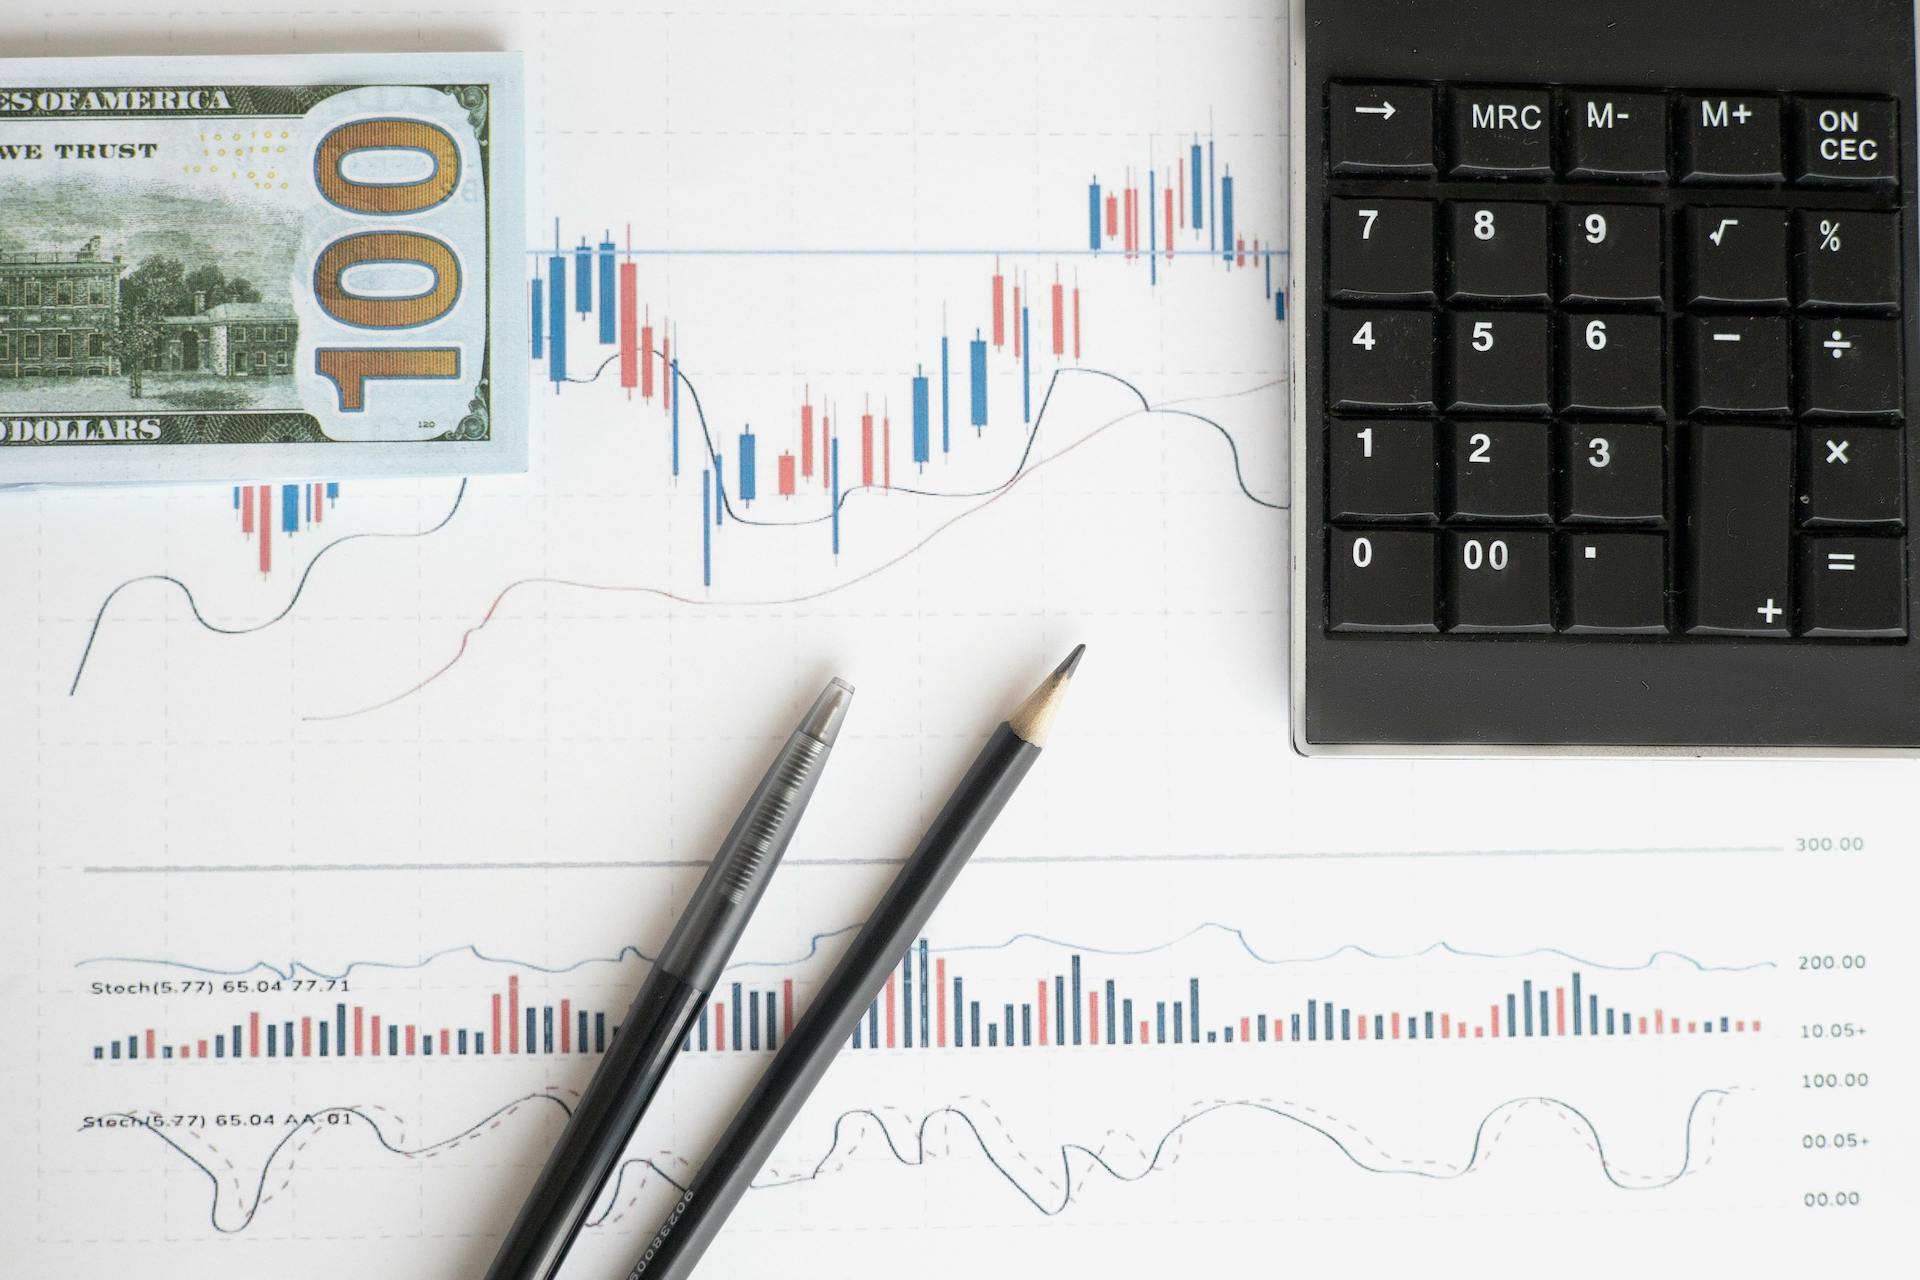
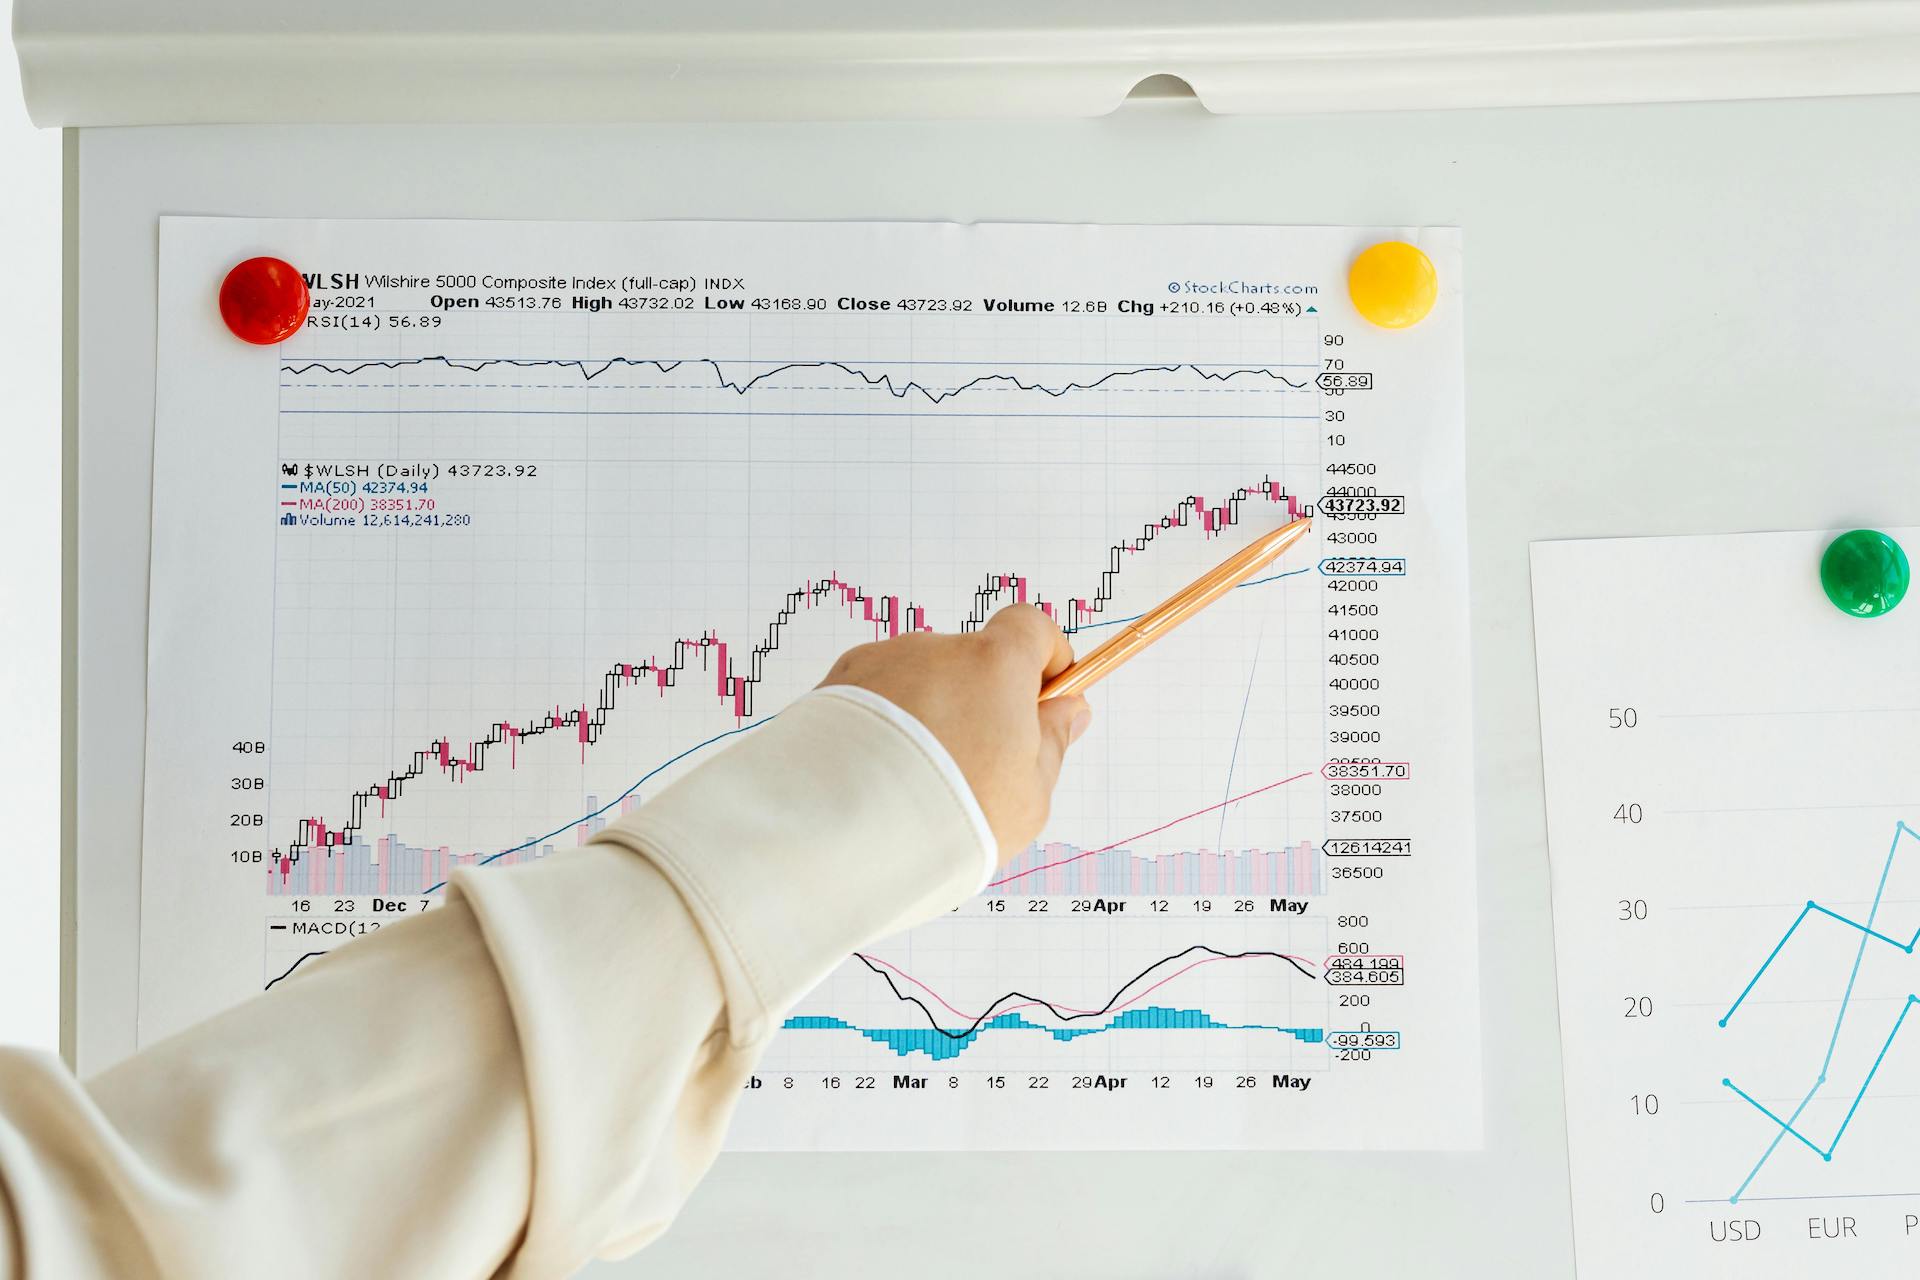
Bar charts are an indispensable tool in the arsenal of modern traders. They offer detail and clarity that can significantly enhance your trading strategy. Unlike line charts showing closing prices, bar charts provide a more comprehensive view of market activity by incorporating open, high, low, and close (OHLC) prices.
This guide explores the strengths, weaknesses, and practical applications of bar charts, ensuring you have the insights to make informed trading decisions.
Why Bar Charts Are Essential for Traders
Understanding bar charts’ core components and benefits is crucial for traders seeking to maximize their market analysis. Let’s explore what makes bar charts vital to any trader’s toolkit.
What Is a Bar Chart?
A bar chart is a financial chart that provides a graphical representation of price movements over a specific period. Unlike line charts, which display only closing prices, bar charts present four essential data points:
- Open Price: The price at which the asset starts trading for the period.
- High Price: The highest price reached during the period.
- Low Price: The lowest price observed.
- Close Price: The price at which the asset finishes trading for the period.
These data points are visualized as vertical bars, with horizontal ticks to the left and right representing the opening and closing prices. This structure allows traders to see the entire range of price movements at a glance.
Strengths of Bar Charts
Bar charts provide traders with a wealth of information, but their true power lies in their specific advantages. Understanding these strengths can help you leverage bar charts effectively in your trading strategy.
1. Complete Price Information
One of the most significant benefits of bar charts is their ability to display comprehensive price data. Bar charts provide a full snapshot of market activity by including the open, high, low, and close prices. This detailed view allows traders to analyze price volatility, identify trends, and pinpoint potential entry and exit points precisely.
2. Balanced Clarity and Detail
While bar charts offer a detailed view of the market, they maintain a clean and uncluttered appearance. This makes them an excellent middle ground between the simplicity of line charts and the complexity of candlestick charts.
Traders can enjoy detailed market insights without being overwhelmed by visual clutter, especially when analyzing multiple assets simultaneously.
3. Versatility Across Timeframes
Bar charts are highly adaptable and can be used effectively across various timeframes. Whether you’re a day trader focusing on minute-by-minute price movements or a long-term investor analyzing monthly trends, bar charts provide the flexibility to suit your needs. This versatility makes them a go-to tool for traders with diverse strategies and goals.
Weaknesses of Bar Charts
Despite their many advantages, bar charts have limitations. Knowing these weaknesses will help you determine when bar charts are the right tool for your analysis.
1. Less Intuitive Visuals
Although bar charts present a wealth of data, they may not be as visually intuitive as other chart types, such as candlestick charts. The absence of color coding and the use of horizontal ticks for open and close prices require a more trained eye to interpret quickly.
For novice traders, this can lead to slower decision-making and potential misinterpretation of market signals.
2. Potential Clutter on Short Timeframes
Bar charts can become cluttered in highly volatile markets, especially for short-term analysis. The rapid appearance of multiple bars in quick succession can make it difficult to discern patterns and trends. This can hinder traders who rely on clear, immediate insights to execute timely trades.

When to Use Bar Charts
Knowing when to use bar charts can significantly enhance your trading efficiency. These charts excel in specific scenarios, providing traders with valuable insights that other chart types may not offer.
Ideal Scenarios for Bar Charts
Bar charts shine when detailed price analysis and a balanced view of market activity are required. Let’s explore some ideal use cases for bar charts.
1. In-Depth Price Analysis
Bar charts are an excellent choice for traders who require a detailed understanding of market dynamics. Including OHLC data allows for thoroughly examining price action, helping traders assess volatility, momentum, and potential reversal points. This makes bar charts particularly valuable for intraday trading, where precise data is crucial for making split-second decisions.
2. Medium- to Long-Term Trading
Bar charts are not limited to short-term analysis. Their versatility makes them equally practical for medium- to long-term trading strategies. Traders can use bar charts to track trends over weeks or months, gaining insights into market cycles and potential long-term opportunities.
This balance of detail and clarity ensures that bar charts remain relevant across different trading horizons.
Bar Charts vs. Candlestick Charts: Which Is Better?
Choosing between bar charts and candlestick charts often depends on your trading style and objectives. While both chart types offer comprehensive market insights, they cater to different preferences and analytical needs.
Candlestick charts are more visually intuitive, with color coding that quickly conveys market sentiment. However, bar charts offer a cleaner, more structured view of price data, making them ideal for traders prioritizing detail over immediate visual cues. Understanding these differences will help you select the chart type that best aligns with your trading strategy.
How Vestrado Can Help You Optimize Your Trading
At Vestrado, we’re dedicated to empowering traders with the tools and insights needed to succeed in today’s fast-paced markets. Our platform offers advanced charting options, including bar charts, to help you analyze market trends confidently.
Whether you’re a beginner or an experienced trader, Vestrado provides the resources and support necessary to elevate your trading game.
Don’t let market complexity hold you back. With Vestrado, you can harness the power of bar charts and other advanced trading tools to make smarter, more informed decisions. Join our growing community of traders today and experience the difference that expert insights and cutting-edge technology can make.
Start Trading Smarter Today
Unlock your trading potential with Vestrado. Sign up now and gain access to real-time market analysis, personalized trading strategies, and a wealth of educational resources designed to help you thrive in any market condition.
Explore Vestrado and discover how our tools and insights can help you master the markets with confidence.


