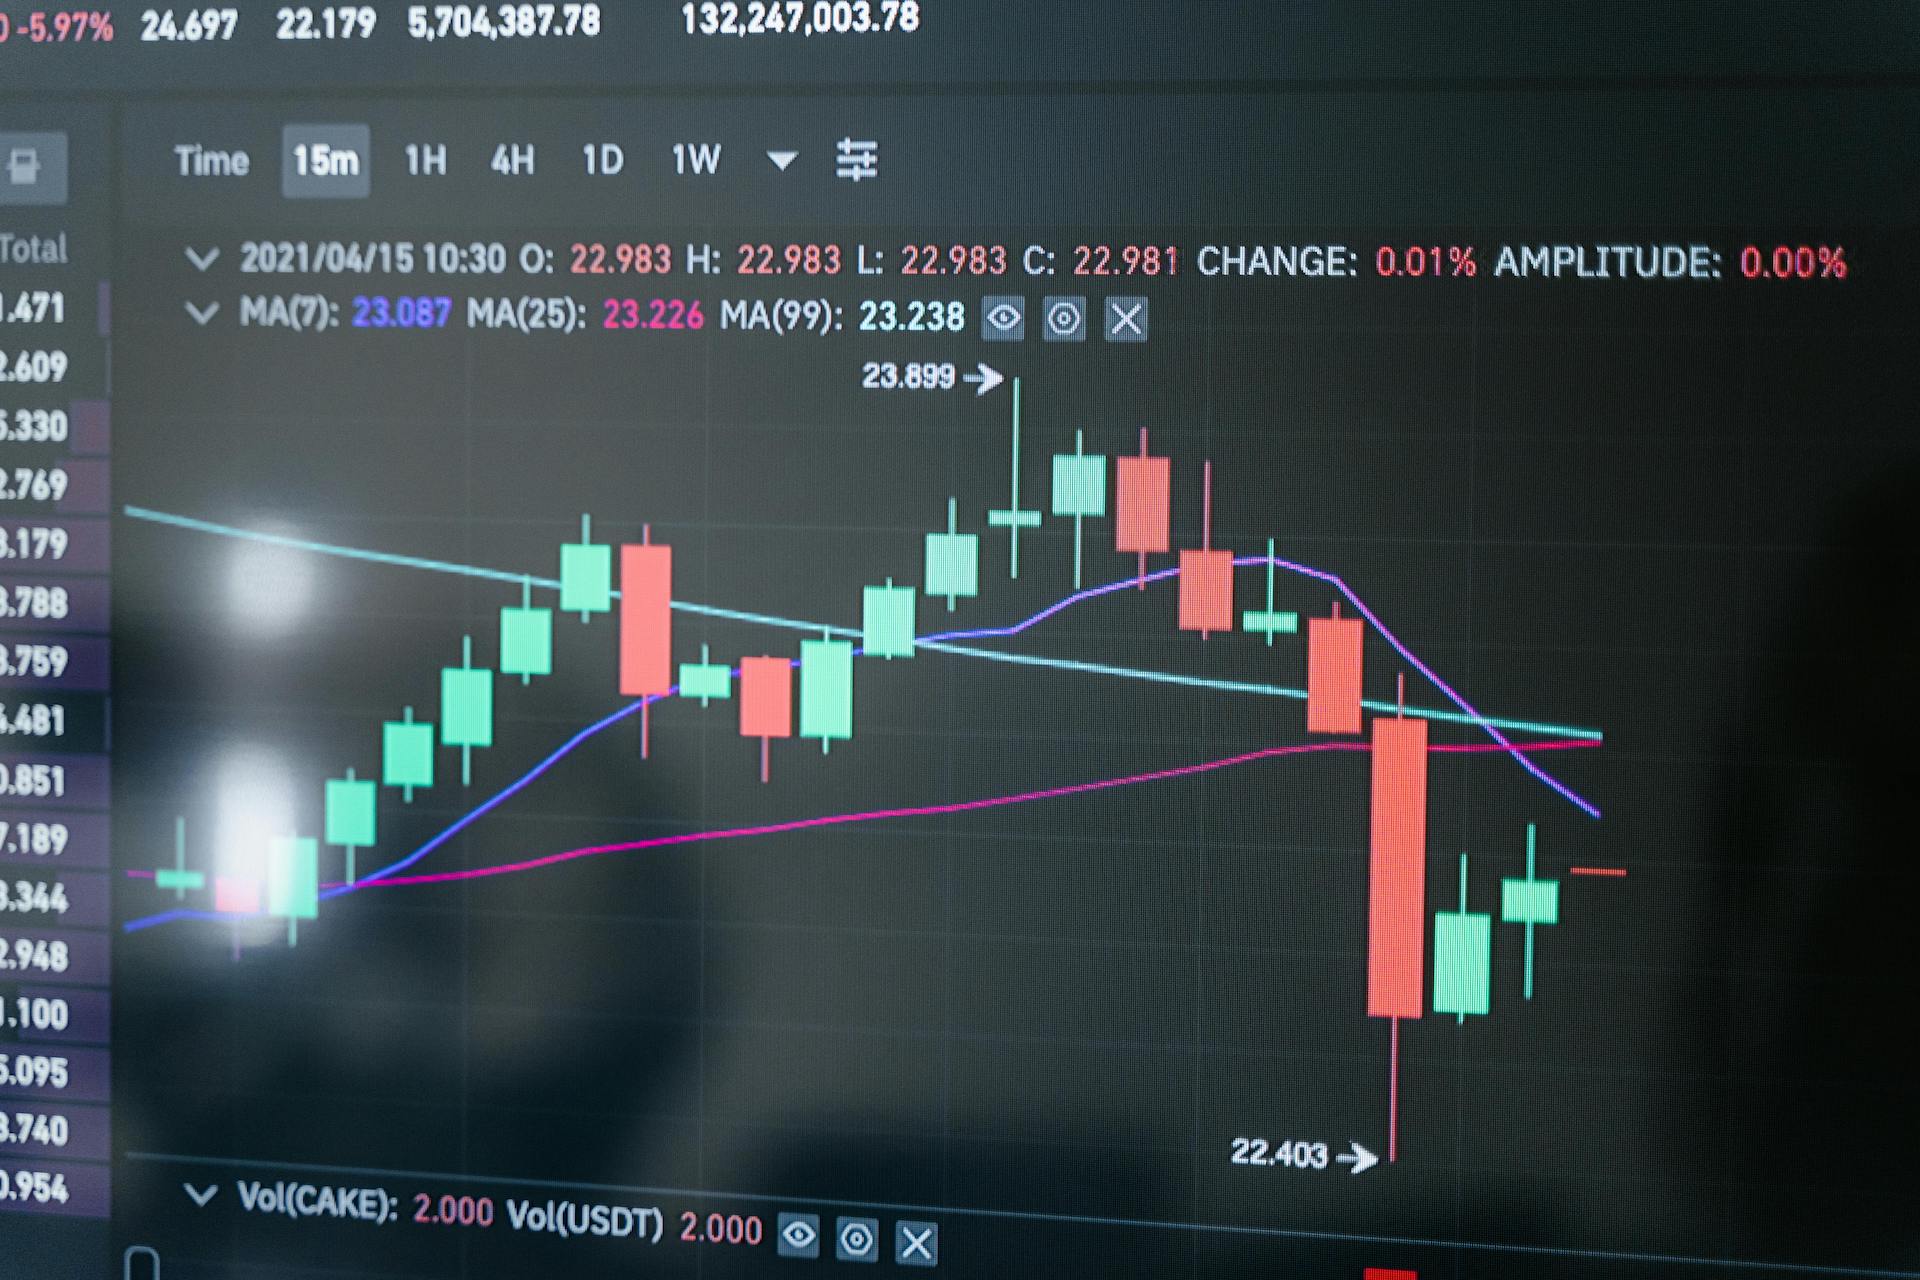
Understanding support and resistance is key to making informed trading decisions. But how do you know if a level was broken? Let’s break it down step by step so you can avoid false signals and improve your trading strategy.
What Are Support and Resistance Levels?
Support and resistance are price levels where buying or selling pressure reverses the market’s direction.
- Support is a level where the price stops falling and bounces back up because buyers step in.
- Resistance is a level where the price stops rising and starts decreasing as sellers take control.
But the challenge lies in determining when these levels are truly broken. Let’s explore further.
Is Support or Resistance Really Broken?
There is no single, definitive answer to this question. Traders often debate on what counts as an actual break. Some say it’s broken when the price closes past the level, but this is unreliable.
Let’s look at an example:
- Imagine the support level is at 1.4700.
- The price closes below 1.4700, suggesting support was broken.
- However, shortly after, the price bounces back above 1.4700.
What Does This Mean?
In this case, support was breached temporarily, but not truly broken. The level remains intact and often becomes more substantial because it has been tested again.
To avoid being misled, traders should think of support and resistance as zones rather than fixed numbers.
How to Filter Out False Breakouts
False breakouts are common in trading, but there are methods to minimize their impact.
1. Use Line Charts Instead of Candlestick Charts
- Line Charts: Focus only on the closing price, filtering out market noise.
- Candlestick Charts: Show highs and lows, which can include “knee-jerk” market reactions.
Using a line chart, you can identify the zones where price consistently reverses.
2. Focus on Key Zones, Not Exact Levels
Instead of drawing a single line at support or resistance, think of it as a zone. These zones represent areas where price peaks (resistance) or valleys (support) repeatedly occur.
Example:
- If the price reverses around 1.4700 multiple times, you can consider 1.4680 to 1.4720 as a support zone.
- This approach reduces the risk of false signals caused by slight price fluctuations.
What Happens When Support or Resistance Is Truly Broken?
When support or resistance is broken, it often signals a significant shift in market sentiment. Here’s what happens next:
Breaking Support
- If support is broken, it means sellers have taken control.
- The price is likely to fall further, leading to a bearish trend.
- Traders often look for opportunities to go short (sell).
Breaking Resistance
- If resistance is broken, it means buyers are in control.
- The price is likely to rise further, signaling a bullish trend.
- Traders may look for opportunities to go long (buy).
Practical Steps to Trade Support and Resistance
Here are actionable tips for Vestrado users to make better trading decisions:
- Identify Key Support and Resistance Zones: Use line charts to spot areas where prices consistently bounce or reverse.
- Wait for Confirmation: Ensure the price closes beyond the zone and holds its position before acting.
- Combine with Indicators: Use tools like Moving Averages or RSI (Relative Strength Index) to confirm breakouts.
- Watch for Retests: After breaking a level, the price often retests that zone. If it holds, the breakout is likely genuine.
- Set Stop Loss Orders: Always protect your trades with stop losses if the breakout is false.
Example Scenario: Identifying a Breakout
Suppose you’re trading forex and spot a resistance zone at 1.5000.
- The price rallies and closes above 1.5000.
- You wait for a retest, and the price touches 1.5000 again but doesn’t fall below it.
- This confirms that resistance has turned into support.
- You enter a long trade with a stop loss slightly below 1.5000.
You reduce the chances of acting on a false breakout by waiting for confirmation.
Why Accurate Breakout Analysis Matters
Trading with false signals can lead to unnecessary losses. By focusing on zones, confirmation, and practical strategies, traders can:
- Make better decisions
- Avoid false breakouts
- Improve profitability in the long run
Start Mastering Support and Resistance Breakouts with Vestrado
Understanding support and resistance is easier when you have the right tools and guidance. At Vestrado, we provide educational resources, expert strategies, and powerful tools to help you trade confidently.
Whether you’re new to trading or a seasoned investor, Vestrado is here to help you:
- Identify key support and resistance levels.
- Avoid false breakouts with practical strategies.
- Trade more innovative with proven techniques.
Take your trading skills to the next level. Join Vestrado today and start trading with confidence!
Identifying true support and resistance breakouts is essential for successful trading. Treating these levels as flexible zones and using tools like line charts allows you to filter out false signals and make better decisions.
With Vestrado, you’ll gain the skills, tools, and confidence to master these techniques and grow as a trader. Don’t miss the opportunity to refine your strategy and improve your trading results.
Ready to trade smarter? Visit Vestrado and start your journey today!


