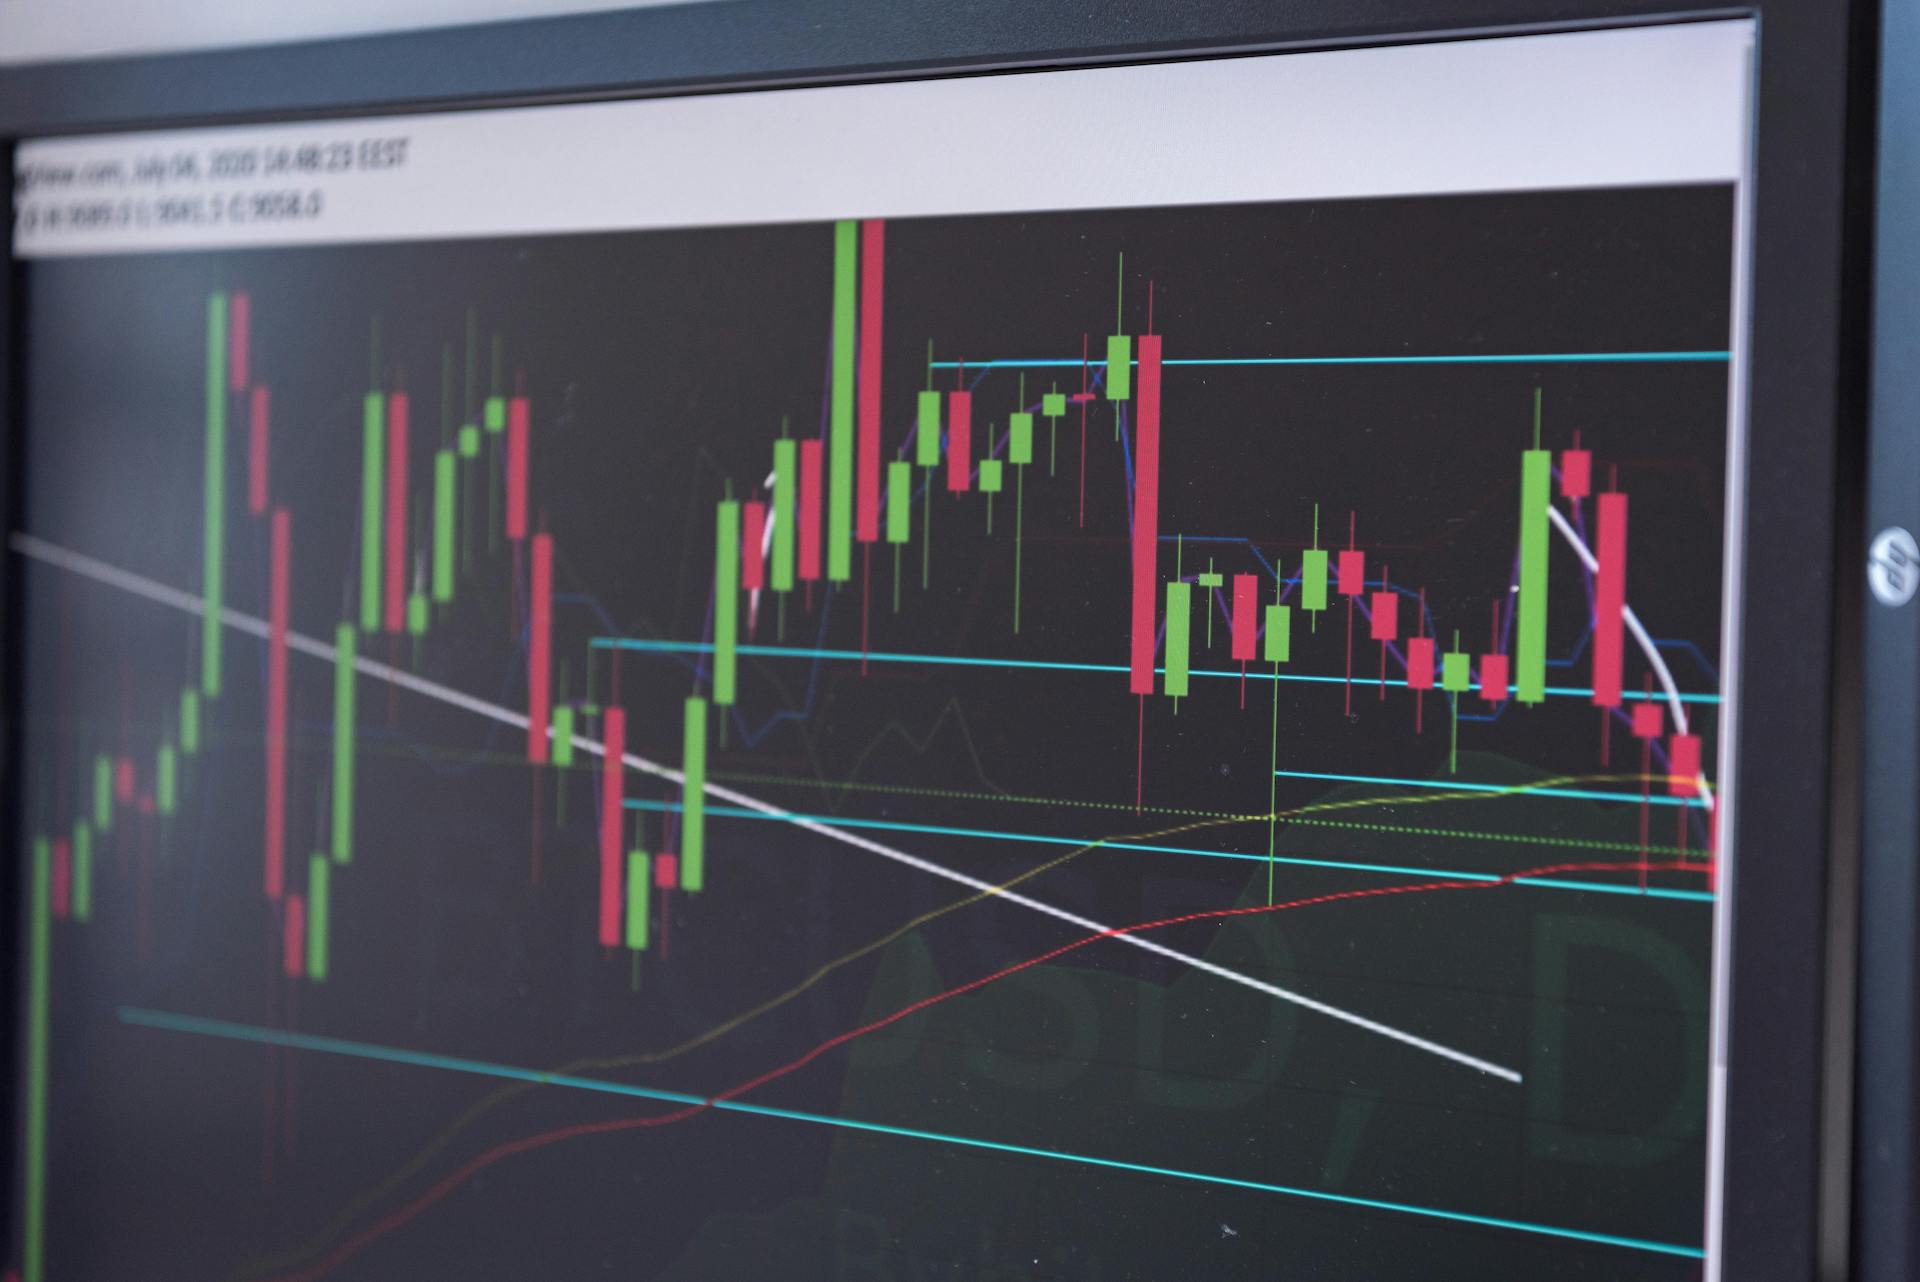
Analysing price movement is essential for making informed trading decisions in forex trading. While several chart types are available, bar charts, also known as OHLC charts, offer a more comprehensive view by showing the Open, High, Low, and Close prices for each period.
This type of chart allows traders to visualise market volatility and trends more effectively, making it an invaluable tool for technical analysis.
In this article, we’ll dive into the essentials of bar charts, covering how they work, their components, and how they differ from other chart types. By the end, you’ll thoroughly understand how to leverage bar charts in your trading strategy.
What is a Bar Chart in Forex Trading?
A bar chart in forex trading is a graphical representation that displays the opening and closing prices and the highs and lows of a currency pair over specific time frames. Unlike line charts, which only track closing prices, bar charts provide a more detailed view of price activity within each period, allowing traders to understand the price range for that period. This makes bar charts particularly useful for analysing trends and market sentiment.
Each bar represents a single period (e.g., a minute, hour, or day), and its size reflects the volatility within that time frame. The larger the bar, the more the price fluctuated; the smaller the bar, the quieter the market.
Critical Components of a Bar Chart
To fully grasp how to interpret a bar chart, let’s break down its main components:
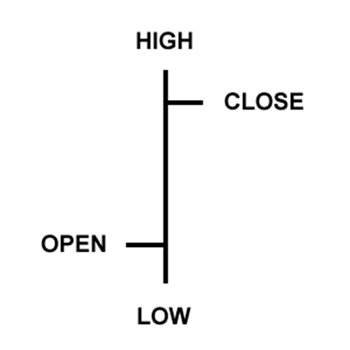
1. Vertical Bars Indicating Price Range
- Each bar’s height represents the trading range within a specific time period. The bottom of the bar shows the lowest traded price, while the top indicates the highest price reached.
- Larger bars signify higher volatility, where prices fluctuate significantly within the period. Smaller bars indicate lower volatility and quieter trading periods.
2. Opening and Closing Prices
- A horizontal hash on the left side of the bar marks the opening price.
- A horizontal hash on the right side marks the closing price.
- By looking at these two points, traders can gauge the overall price movement during the period. A bar with a closing price higher than the opening price suggests a bullish trend (price increase), while a closing price below the opening indicates a bearish trend (price decrease).
3. OHLC Structure
- Bar charts are often called OHLC charts because they display each period’s Open, High, Low, and Close prices. This makes it easier to analyse price behaviour and market trends in greater depth than a line chart.
Example: A Bar Chart of EUR/USD
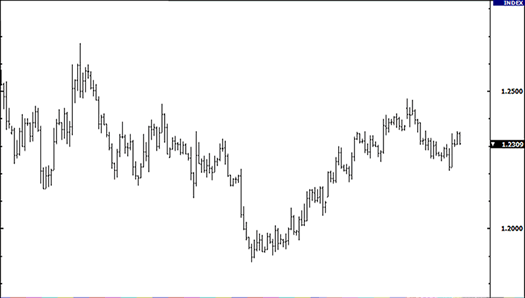
Imagine you are looking at a bar chart for the EUR/USD currency pair over a one-hour timeframe. Here’s how it would look:
- The vertical bar height shows the range of price movement within the hour.
- The left hash represents the price at the hour’s start (opening).
- The right hash represents the price at the end of the hour (closing).
- Larger bars on the chart might indicate increased activity due to news events or market volatility.
How Bar Charts Help in Analyzing Market Trends
Bar charts can reveal essential insights into market behaviour that are not easily observable in other charts. Let’s explore the benefits they provide:
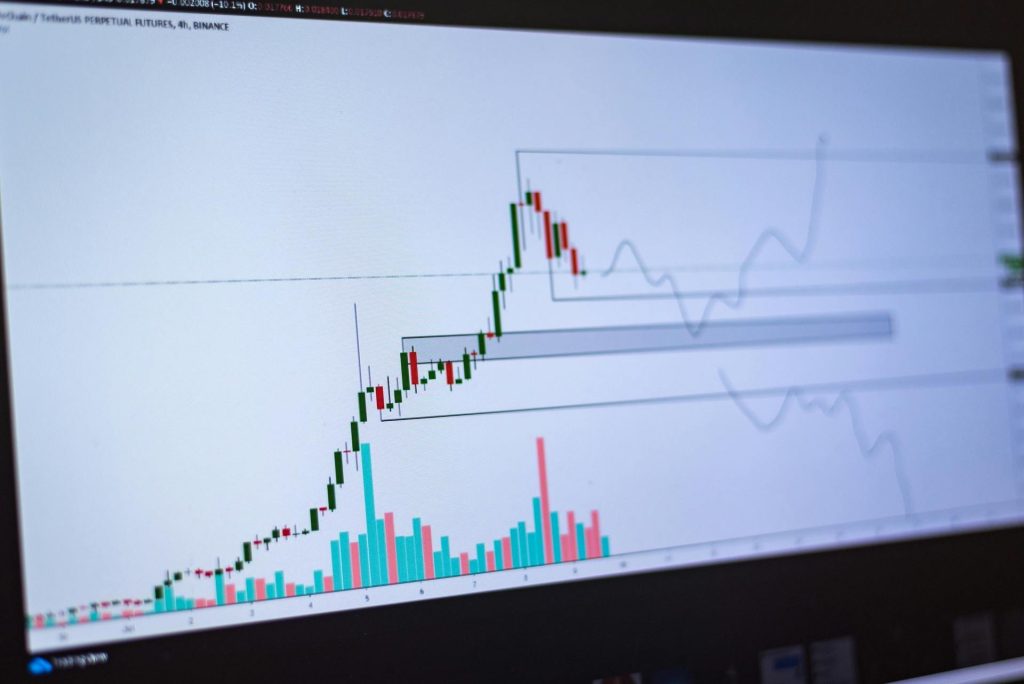
1. Visualizing Price Volatility
- The size of the bars allows traders to assess volatility levels quickly. In times of high market volatility, bars appear larger, signalling intense price movements. In contrast, smaller bars suggest a calmer market.
- For instance, bar sizes tend to increase during major economic announcements or geopolitical events, indicating higher volatility and providing traders with visual clues to adjust their trading strategies.
2. Identifying Price Trends and Reversals
- Traders can identify trends by observing the position of the open and close prices. A series of bars where the close price is consistently higher than the open price indicates an upward trend, while a series of closes below opens signals a downward trend.
- When bar sizes start decreasing, it can signal a loss of momentum, potentially indicating a trend reversal.
3. Spotting Key Support and Resistance Levels
- Bar charts highlight the highs and lows of each trading period, enabling traders to spot support and resistance levels. Frequent highs or lows around specific price points can indicate strong resistance or support areas.
- For example, if prices fail to break a specific high over multiple bars, it may signal a resistance level, prompting traders to be cautious or take profit at that level.
4. Understanding Market Sentiment
- The open-close positions about each other reveal whether buyers or sellers dominated the period, giving clues to market sentiment. A bar closing near its high implies buyers’ control, while a close near the low indicates sellers’ dominance.
Bar Charts vs. Line Charts: Key Differences
While line charts are simpler and only show closing prices, bar charts offer a more comprehensive view by illustrating each period’s open, high, low, and close prices. Here’s a quick comparison:
| Feature | Bar Chart (OHLC) | Line Chart |
| Data Displayed | Open, High, Low, Close Prices | Closing Prices Only |
| Volatility View | Clearly shows volatility through bar size | Limited volatility insight |
| Trend Analysis | Detailed trends and reversals | Basic trend information |
| Market Sentiment | Easy to gauge based on open-close positions | Limited sentiment analysis |
For traders seeking a deeper insight into price movement and volatility, bar charts provide greater depth than line charts. However, they do require a bit more interpretation.
Advantages of Using Bar Charts in Forex Trading
1. Comprehensive Price Information
- Bar charts offer a complete picture by displaying all essential price points (OHLC), allowing traders to make more informed decisions based on accurate market conditions.
2. Enhanced Volatility Analysis
- The ability to visualise volatility by simply observing the bar size makes these charts invaluable during periods of high price fluctuation, helping traders prepare and respond accordingly.
3. In-depth Trend and Sentiment Analysis
- Bar charts allow traders to analyse trends more precisely, as the position of open and close points reflects the market sentiment for each period. Recognising these nuances can improve trading accuracy.
4. Ability to Detect Reversals
- The details provided by bar charts make it easier to spot trend reversals early. By observing a reduction in bar size or consistent price behaviour, traders can anticipate potential shifts in market direction.
Practical Tips for Using Bar Charts in Your Trading Strategy
When using bar charts in your trading strategy, consider the following tips:
- Pair with Technical Indicators: Use bar charts alongside indicators like Moving Averages or Relative Strength Index (RSI) to confirm trends and potential reversals.
- Analyse Multiple Timeframes: View bar charts across various timeframes (e.g., daily and weekly) to better understand market trends and fluctuations.
- Identify Consistent Patterns: Look for recurring patterns in bar sizes and open-close relationships to spot trading opportunities, such as breakouts or consolidation periods.
Conclusion: Leverage Bar Charts for Informed Trading Decisions
Bar charts, with their OHLC format, offer forex traders a powerful tool to visualise price ranges, volatility, and market trends comprehensively. By understanding the essential components of bar charts, traders can make better-informed decisions, anticipate market shifts, and refine their trading strategies. Whether you’re a novice or an experienced trader, mastering bar chart analysis can give you a competitive edge in the dynamic world of forex trading.
Start incorporating bar charts into your trading toolkit and gain valuable insights that can help elevate your trading performance. Remember, the more you practice interpreting bar charts, the more skilled you’ll become at spotting key trends, volatility patterns, and potential reversals. Happy trading!