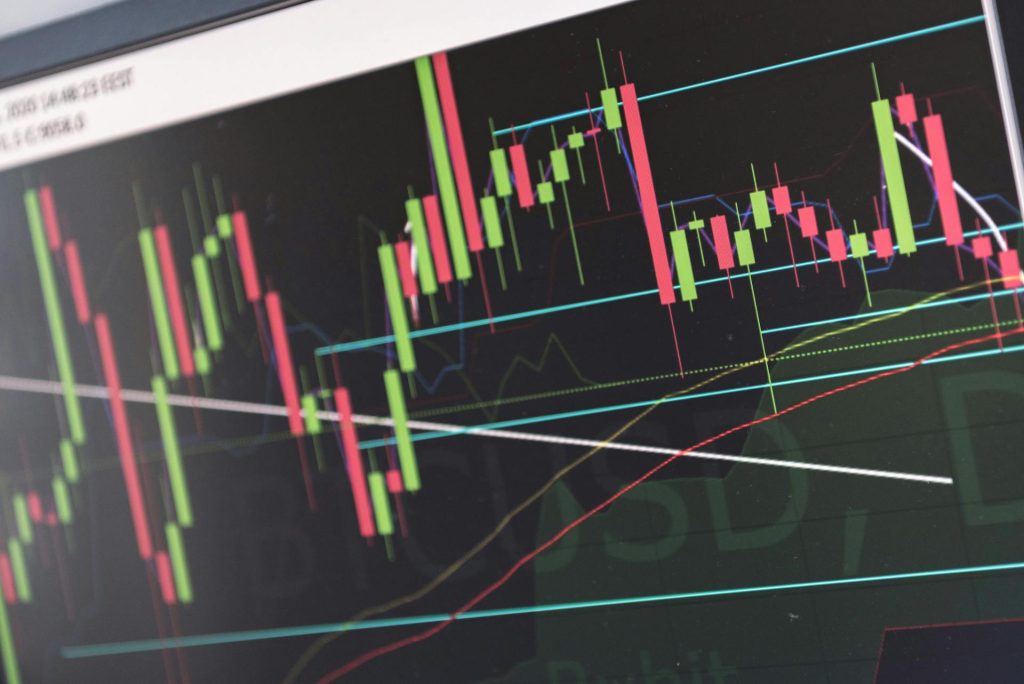
When trading, selecting the right chart can make or break your strategy. The candlestick chart is one of the most widely used and trusted tools. It is a favorite among traders because it presents vital market data intuitively.
They combine the same OHLC (Open, High, Low, Close) data found in bar charts but deliver it in a visually striking format that simplifies decision-making.
In this article, we’ll explore what makes candlestick charts indispensable, examine their strengths and weaknesses, and offer practical advice on how to use them effectively. By the end, you’ll see how this tool can elevate your trading journey—especially when paired with Vestrado’s innovative solutions.
What is a Candlestick Chart?
A candlestick chart is a graphical representation of price movements over a specific period. Each “candlestick” encapsulates an asset’s open, high, low, and close prices. Its unique color-coded design makes it easier to interpret market trends and sentiment at a glance.
Here’s what each candlestick typically consists of:
- Body: The rectangular portion represents the range between the open and closed prices.
- Wicks (Shadows): Thin lines extending from the body, indicating the highest and lowest prices during the period.
- Colors: Green (or white) for bullish movements and red (or black) for bearish movements.
Strengths of Candlestick Charts
Candlestick charts offer a unique blend of visual appeal and analytical depth that can greatly benefit traders at all levels. Their design allows for quick interpretation of price movements, enabling traders to make swift decisions based on market behavior.
In this section, we will delve into the key strengths of candlestick charts, highlighting how their clear visual representation, ability to uncover patterns, and insights into market sentiment can enhance your trading strategy and elevate your overall performance in the financial markets.
1. Clear Visual Representation
Candlestick charts are popular for their visual clarity. Unlike bar charts, candlestick bodies are color-coded, making it instantly recognizable whether a session ended in a bullish or bearish movement. This intuitive representation helps traders make quick decisions without extensive analysis.
2. Pattern Recognition for Smarter Trades
One of the standout features of candlestick charts is the ability to identify price patterns and predict market movements. Patterns such as:
- Doji: Signals market indecision.
- Hammer: Indicates potential reversal after a downtrend.
- Engulfing: Suggests a strong trend continuation or reversal.
By mastering these patterns, traders can anticipate potential shifts in momentum and act accordingly.
3. Instant Insight into Market Sentiment
The size and color of a candlestick provide a snapshot of market sentiment.
- A large green candlestick indicates intense buying pressure.
- A long red candlestick suggests selling dominance.
This quick analysis is particularly beneficial for traders seeking to gauge whether bulls or bears are in control.

Weaknesses of Candlestick Charts
1. Complexity for Beginners
While visually engaging, candlestick charts can overwhelm beginners. Properly interpreting candlestick patterns requires study and experience, which may pose a steep learning curve for those new to trading.
2. Clutter in High-Volatility Markets
Candlestick charts can become cluttered in highly volatile markets or short timeframes. Excess information may obscure meaningful patterns, making analysis more challenging.
When to Use Candlestick Charts
Candlestick charts are powerful tools that provide traders with valuable insights into market movements and sentiment. Understanding when to utilize these charts can significantly enhance your trading strategy.
Whether you’re engaged in short-term trading or analyzing broader market trends, recognizing the optimal moments to apply candlestick charts can lead to smarter, more informed decisions. In this section, we will explore the key scenarios in which candlestick charts shine, helping you refine your approach and capitalize on market opportunities.
1. Short-Term Trading and Pattern Analysis
Day traders and swing traders rely heavily on candlestick charts to reveal patterns in real-time. Whether identifying trend reversals or confirming continuations, these charts provide the granularity needed for rapid decision-making.
2. Market Sentiment Analysis
Candlestick charts excel at revealing market sentiment. Traders who want to understand whether buyers or sellers dominate the market find these charts far more insightful than bar or line charts.
How Vestrado Can Help
At Vestrado, we understand the importance of choosing the right tools to maximize your trading success. Our platform offers a range of advanced features that complement candlestick chart analysis, including:
- Real-Time Market Data: Get instant updates to refine your trades.
- Pattern Recognition Tools: Simplify the process of identifying critical candlestick patterns.
- Customizable Charting Options: Tailor your charts to match your trading strategy.
With Vestrado, you’re not just analyzing the market but staying ahead.
Why Traders Trust Candlestick Charts
Candlestick charts are indispensable for modern traders because they combine powerful visual tools with actionable insights. From novice traders starting their journey to seasoned experts looking to refine strategies, these charts cater to all levels.
However, leveraging their full potential requires the right support system. That’s where Vestrado comes in. Our trading platform empowers you to harness the strengths of candlestick charts, helping you unlock new opportunities in the financial markets.
Unlock the Power of Candlestick Charts with Vestrado
Ready to enhance your trading experience? With Vestrado, you can access cutting-edge tools and resources that simplify complex market analysis, enabling you to trade smarter and confidently.
Start your journey today with Vestrado and experience the difference. Explore candlestick charts and beyond—trade smarter, not harder.
Discover how intuitive market analysis can elevate your trades. Join Vestrado now and access the tools you need to succeed in today’s fast-paced financial markets.


